1. First steps
2. Creating the master page
3. Creating pie charts
4. Creating flow charts
5. Creating interactive navigational buttons
6. Publishing your presentation as a full screen PDF
You can create great looking presentation graphics with CorelDRAW X3. To show your slide-show in full screen, you just have to export your document as a full screen PDF.
Here is how to create your slide show, step by step:
Open CorelDRAW X3 and start a new document.
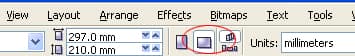
Click the Landscape button in the Property bar.
The size of the document doesn’t matter, as the end result, the full screen PDF, will fit to the screen.
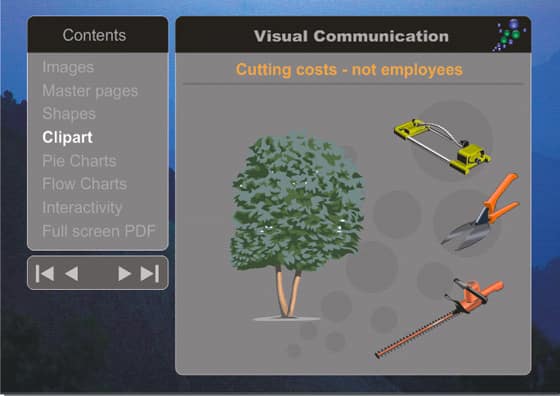
First, you need to create a master page. A master page contains all the design elements that will be shown on all pages, e.g. the background, a logo, a title etc.
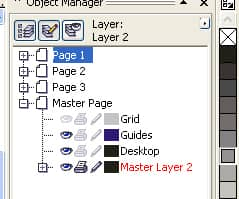
Select Window | Dockers | Object Manager. A Docker opens at the right side of the screen:
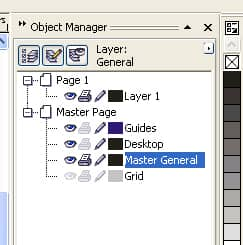
Right click on the Master page, and select New Master Layer.
Rename this layer “General”, and a new layer, “Master General”, is created.
Select a suitable image for the background from the CorelDRAW Graphics Suite X3 CD number 3. Insert the CD. Select the Window menu | Dockers | Scrapbook | Browse. Select the desired image or clipart and drag it from the docker on to the page, and it will be inserted in your document. Scale the image until it fits the page, by dragging the midpoints on the top and side of the image.
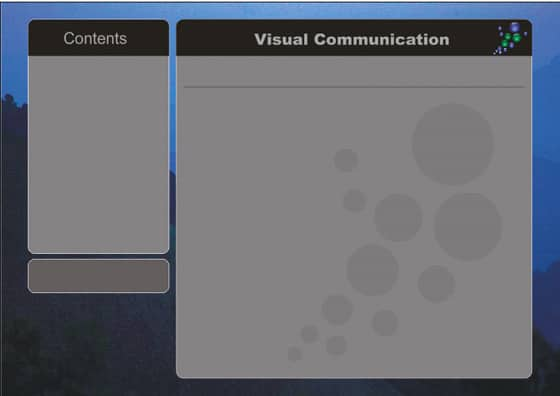
No matter what image you have chosen for the background, it will always interfere with text and other messages. Therefore you should create some information boxes that will make the text and messages stand out.
To create the information boxes, insert two rectangles like shown in the picture below by using the rectangle tool from the tool bar.
To round the corners of the rectangles, select the rectangle. Select the Shape Tool from the tool bar.
![]()
The rectangle has 4 anchor points, one in each corner. When you drag one of these points, you can round the corners.
Notice that the Property Bar follows your move with the mouse, indicating that you can type the rounding in those fields.
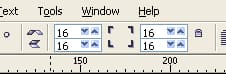
To the right of these fields, you will find a lock icon. When you disable this lock, you can round the corners separately.

Fill the rectangles with 50% grey by using the Fill Tool. This colour is good for white text.
To create the black area at the top of the rectangles, draw a horizontal line using the Bezier Tool (see screenshot below). Click on the Smart Fill Tool and select black to fill the area.
The rectangle to the left will be used as a navigational area, while the rectangle to the right will be used for the actual information. You might want to draw a darker grey line to separate a headline of text from the sub-information.
To draw the line, select the Bezier Tool in the row of Freehand Tools.
![]()
Click on the page, press the Ctrl key, and click on the right side of the page. You have now created a horizontal line.
Select the Pick Tool and you can change the thickness of the line in the Property bar.
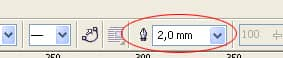
Right click a colour in the Colour palette, and you will change the colour of the line.
Put your company logo into the right top frame by selecting the File-menu | Import. Browse your computer to find the logo, and click the Import button in the Import dialog box.
Insert the header text with a slightly subdued colour (e.g. 30% black) by using the Text Tool:
Now you have the master content, which will be consistent throughout all pages.
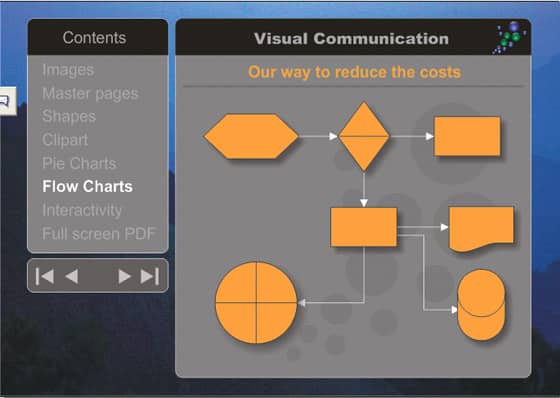
Feel free to experiment with the different information containers. The previous image shows another example, in which the left bottom frame will contain navigational buttons.
Now you can start to work on the content of the individual pages. To switch from the Master page to the individual pages, double click the page icons:
Use the clipart on the CorelDRAW Graphics Suite X3 CD no. 2 or your own images to reinforce your messages. See the first picture in this tutorial.
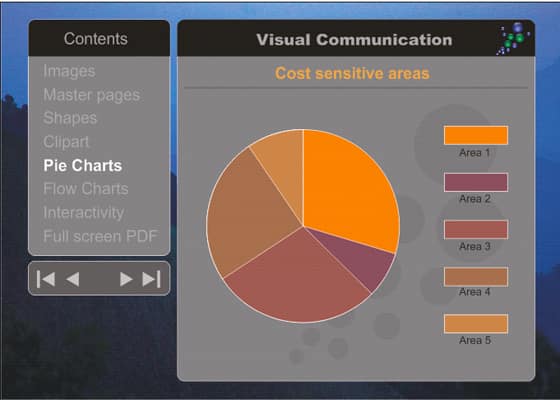
In the second page example you will see a pie chart. CorelDRAW X3 doesn´t contain a chart program feature, so you will have to create the pie chart manually. Here is how:
Add a new page by clicking the “plus” button at the bottom of the page.
On this page you will draw a pie chart of five pieces:
Start by drawing a circle with the Ellipse Tool. Fill it with a light orange colour. Copy the circle, and paste it 4 times.
Each of the circles must be sliced in order to create a pie chart like the one shown in the picture.
CorelDRAW X3 has a feature that makes it possible to transform a circle into pie-pieces or line-segments. You can control this feature with the Shape Tool.
![]()
Select the top circle, and select the Shape Tool. Now the outline of the circle will appear with a dotted line and an anchor point at the top of the circle. When you drag this anchor point counter clockwise, you create pie slices by dragging inside the circle, and line-segments, when you drag outside the circle.
Drag the anchor point until the angle show 36 degrees in the Property bar.
You have created the first pie-slice.
Give the piece a darker orange colour, by Ctrl-clicking the black colour in the colour-palette once or twice. For every click you add 10% of black to the orange colour. Or use whatever colour you like.
Repeat the steps with the other circles, making the slices bigger and darker in colour as you go along.
Write some text, e.g. in white, and place the text next to the slices.
Another way to communicate complex matters is by using a flow chart. CorelDRAW X3 has many ready made symbols that you can use to create a flow chart. And you can also connect the symbols with lines that snap to the symbols. When you rearrange the symbols in the chart, the lines will follow the symbols.
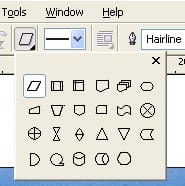
In the Tool box, you will find the Basic Shape Tool.
![]()
This line of tools contains many ready made shapes for you to use. Among the tools are the Flowchart Shapes. When you click this tool, the Property Bar will reveal the available shapes, when you click the Perfect Shapes button.
Select one of the shapes, and drag your mouse to create the chosen shape. Create further shapes to finish the flowchart. Add text and shadows.
How do you add shadows?
In the Tool Box, you will find a line of Interactive tools, just below the Text Tool. In this line of tools, you can find the Interactive Drop Shadow Tool.
![]()
Select the shape that you want to apply the shadow to, and then select the Drop Shadow Tool. Drag the mouse out from the shape and you have created the shadow.
Finish the flowchart by creating lines that connect the shapes. You can change the thickness of all the lines in the Property Bar. You can also add arrow heads to the lines.
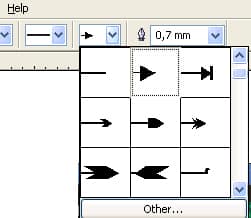
When you use a special Line Tool, the Interactive Connector Tool, the lines snap to the shapes. This means, that if you decide to change the order of the shapes, the lines rearrange accordingly.
![]()
As you can see in the pictures of this tutorial, there are some navigational buttons in the bottom left box. These are in the form of triangles, that points to the first page, the previous page, next page and the last page.
![]()
You can make everything in your drawing interactive. The easiest way to do this is to select the button (symbol) and then right-clicking, and selecting Internet Links in the drop down menu. You then have a list of choices including a list of the pages in your document. You just have to select the appropriate page for your button.
Finally, you can post these pages on the Internet, or as a full screen PDF. To publish your presentation as a PDF, select the File-menu | Publish To PDF.
The Publish To PDF dialog box opens, requesting you to save the file. In the right bottom corner of this box, click on the Settings button and another more complex dialog box opens:
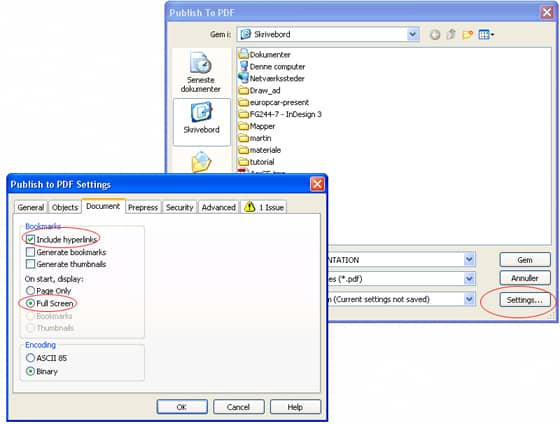
Click on the Document option, and select Full Screen and Include hyperlinks. Finish by clicking the OK button.
When you open the PDF, it opens in full screen.